I’m excited to share a project I’ve been working on for the Summits on the Air community: SOTA Magic, a WordPress plugin designed specifically for SOTA activators. Whether you just finished a grueling hike or a quick local activation, SOTA Magic helps you tell the full story of your activation without having to put in all the work.
With the new “SOTA DATA” block in the editor tool, you can easily upload your GPS track and SOTA formatted CSV logs to create a beautiful, interactive summary of your activation.
Why you’ll love it:
- Interactive Contact Maps: Automatically plots your QSOs on a map using your QRZ credentials and SOTA API data.
- S2S Highlighting: Automatically detects and spotlights those hard-earned Summit-to-Summit contacts.
- Fully Responsive: Your contact tables include horizontal scrolling to ensure they look great on everything from a desktop to a smartphone.
- Complete Customization: Match the colors, fonts, and transparency to your personal blog theme with ease.
A Note on Mapping: To provide the best possible experience for visualizing your hike, SOTA Magic works alongside the popular WP GPX Maps plugin. By pairing these two tools, SOTA Magic can overlay your radio contacts and summit data right alongside your actual GPS trekking path for a complete “Magic” view of your activation.
Stop posting plain text logs and start showing off the true scale of your activations. SOTA Magic is built by an activator, for activators.
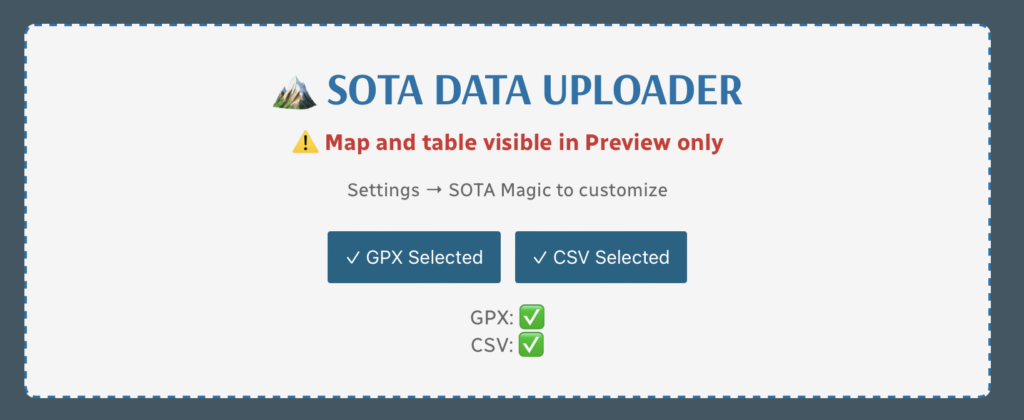
This is what you see on the blog post editor page. You simply point it to or upload GPX and CSV data. SOTA MAGIC waves its wand and does the rest. See below. Everything in the tan box below is auto generated.
Version 0.607 Beta – Activation.Zone API Integration & Debug Tools 🎯
This is a major upgrade to how activation time is calculated! The plugin now integrates with the Activation.Zone API(created by N6ARA – thank you!) to determine your activation zone with much greater precision.
What’s changed:
- Smart Activation Zone Detection – The plugin can now query the Activation.Zone API to find your actual activation zone based on the SOTA rule (25 meters vertical drop from summit). This replaces the simple “radius around the peak” calculation with terrain-aware zone detection. The API analyzes actual elevation data to determine precisely where the activation zone begins and ends!
- Automatic Fallback – If the API is unavailable or you disable it, the plugin automatically falls back to the radius method, so your stats always work
- New Settings Options:
- ✅ Use Activation.Zone API – Toggle to enable/disable the API (enabled by default)
- 🔍 Debug Mode – Administrators can enable a technical debug panel that shows exactly how the activation zone was determined, including API responses, polygon coordinates, and point-by-point calculations. Super helpful for troubleshooting!
- Improved Rest Break Detection – The default rest break threshold is now 3 minutes (down from 10), which better reflects real-world quick stops for water, photos, or antenna adjustments
The Result: Your activation time statistics are now based on the actual SOTA activation zone rather than an estimated circle, giving you and your readers a more accurate picture of time spent on the air vs. hiking!
Version 0.522 – Improved Activation Time Accuracy ✨
The plugin now uses real GPS coordinates from the Activation.Zone API (thanks to N6ARA!) to determine your actual activation zone. Instead of just calculating based on a radius around your highest elevation point, it now queries actual activation zone boundaries to more accurately measure the time you spent operating from within the official SOTA activation zone.
Bonus for troubleshooting: Administrators can now enable a debug window to see how the calculations are working behind the scenes.
Version 0.510 – Better Hiking Time Statistics 📊
Your GPX track analysis got smarter! Here’s what changed:
- Rest breaks are now included in your total hiking time – The plugin recognizes that resting during the hike is part of the hiking experience, so those breaks now show up separately but contribute to your overall hiking time
- Activation time is more precise – The plugin creates an “activation zone” around the summit peak and only counts time when you’re stationary within that zone as activation time
- Clearer separation – You’ll see hiking time (including rest breaks noted separately), activation time (stationary at the summit), and total time – making it easier to understand your day on the mountain
Note: The current version uses a simple radius calculation around the peak. Version .522 improves this with actual activation zone boundaries.
Version 0.509 Beta – Initial Release 🎉
The first public release of SOTA Magic, bringing GPX track maps, contact tables, and statistics to your WordPress SOTA activation posts!
SAMPLE below of reported data using only GPX and SOTA CSV file:
🏔️ Activation GPS Track
(10m breaks)
📊 How Hike Stats Are Calculated
These figures are derived automatically from your GPX track file.
🥾 Hiking Time & Distance
Time and distance accumulated while moving outside the activation zone at a speed above the stationary threshold (default 0.3 km/h). Periods where you were stopped — waiting at a trailhead, taking a break — are excluded and counted separately as Rest Breaks.
⏸️ Rest Breaks
Stationary periods outside the activation zone lasting longer than the rest threshold (default 3 minutes). Anything shorter is ignored as normal GPS noise or a momentary pause. Rest break time is shown inside the Hiking Time box for reference but is not added to hiking time.
📻 Activation Time
All time spent inside the activation zone, regardless of whether you were moving or stationary. This captures the full period from when you first entered the zone to when you left — including any walking around the summit, setting up gear, and operating.
The activation zone boundary is determined by one of two methods (see below).
⏱️ Total Time
The elapsed time from the first to the last GPS trackpoint in the file. This equals Hiking Time + Activation Time + Rest Breaks + any unclassified transition time at the boundaries.
📈 Elevation Gain & Loss
The cumulative altitude gained and lost across all trackpoints. Each uphill step between consecutive points adds to gain; each downhill step adds to loss. Out-and-back routes will show roughly equal gain and loss.
🚶 Hiking Speed
Average speed calculated as Hiking Distance ÷ Hiking Time. Only moving segments outside the activation zone are included, so rest stops and summit time do not drag the average down.
⛰️ Peak & Base Elevation
The highest and lowest elevation values recorded in the GPS track. The highest point is also used as the starting reference for the activation zone when the API method is used.
📍 Activation Zone Methods
API-based zone (currently active): The boundary is retrieved from activation.zone using Digital Elevation Model (DEM) terrain data and the official SOTA rule — the zone extends to where the terrain drops 25 metres below the summit. This is the most accurate method and matches what SOTA adjudicators use.
🗺️ Contact Map
📡 Activation Logbook
| Date | Time | Callsign | Frequency | Mode | My Summit | Their Summit | Comments |
|---|---|---|---|---|---|---|---|
| January 16, 2026 | 1920 | KO6DVZ | 146.450MHz | FM | W6/CT-269 | ||
| January 16, 2026 | 1934 | KD7DTSS2S | 144.100MHz | CW | W6/CT-269 | W6/CT-228 | |
| January 16, 2026 | 1940 | KE6EEK | 144.085MHz | CW | W6/CT-269 | DM04sg | |
| January 16, 2026 | 1949 | NT6E | 144.085MHz | CW | W6/CT-269 | DM03tu | |
| January 16, 2026 | 2002 | K3MGM | 144.215MHz | SSB | W6/CT-269 | DM04TE | |
| January 16, 2026 | 2005 | KE6TH | 144.215MHz | SSB | W6/CT-269 | DM04WD | |
| January 16, 2026 | 2007 | WZ1EEE | 144.215MHz | SSB | W6/CT-269 | DM04TA |
![]()
Leave a Reply